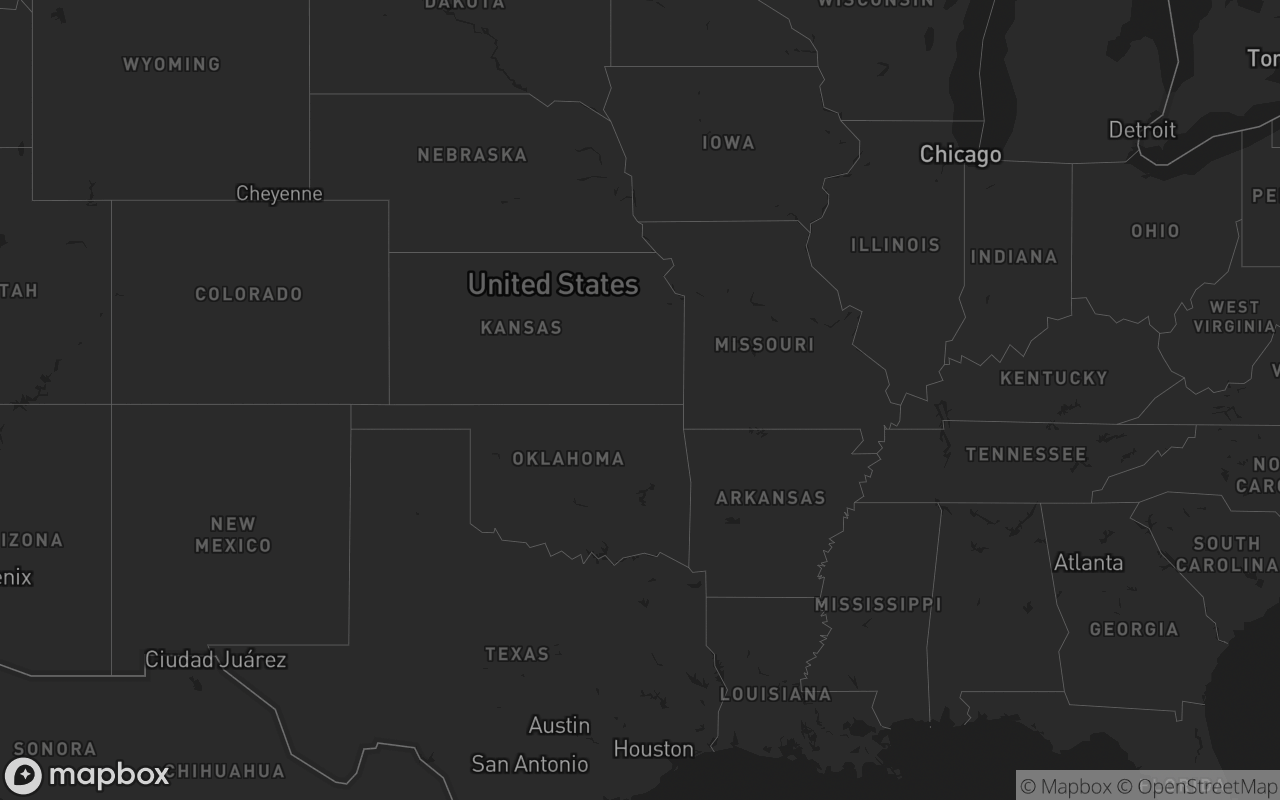
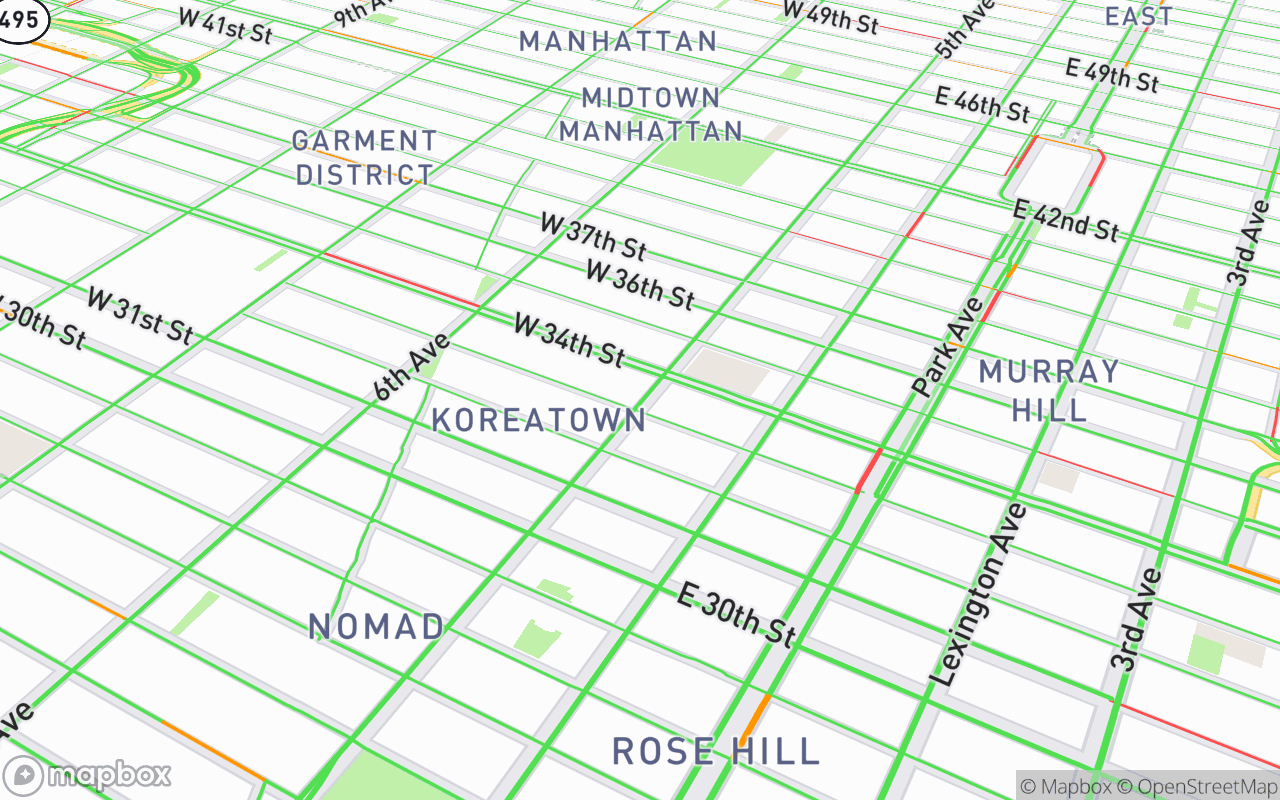
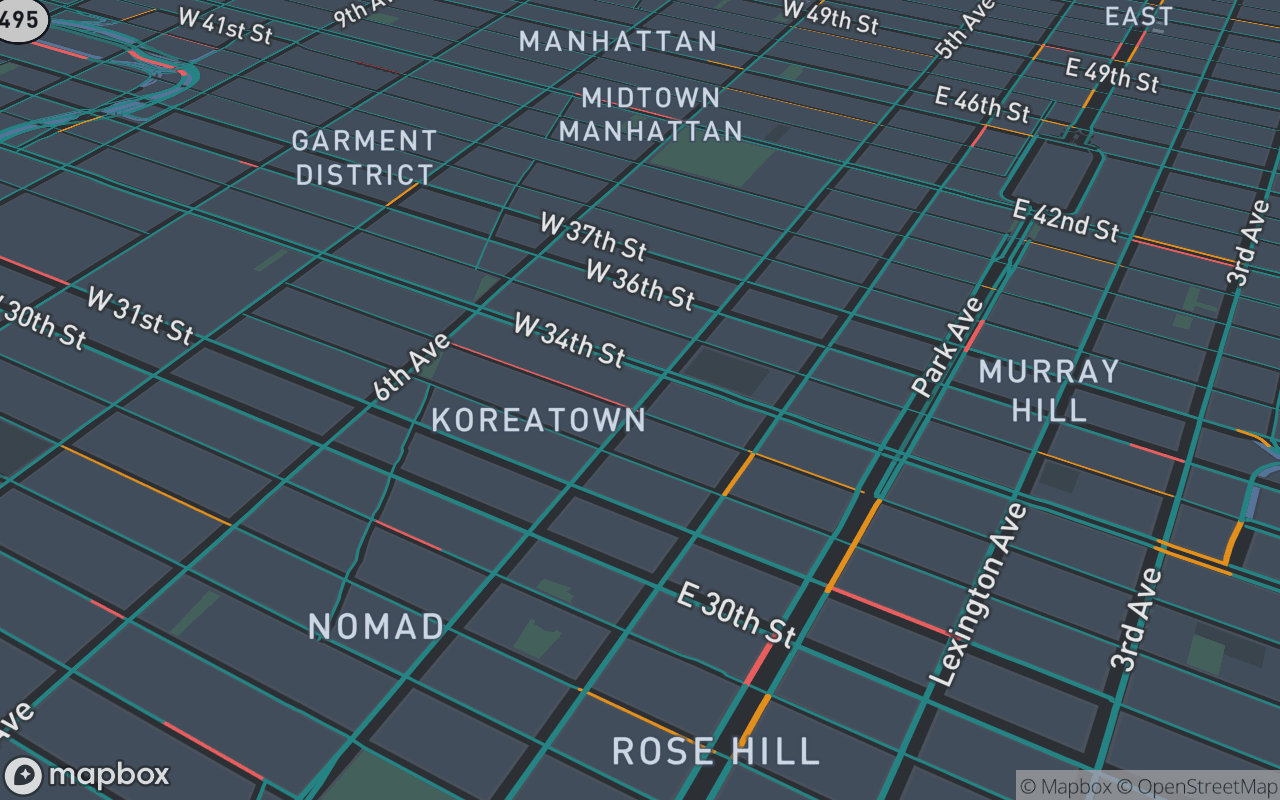
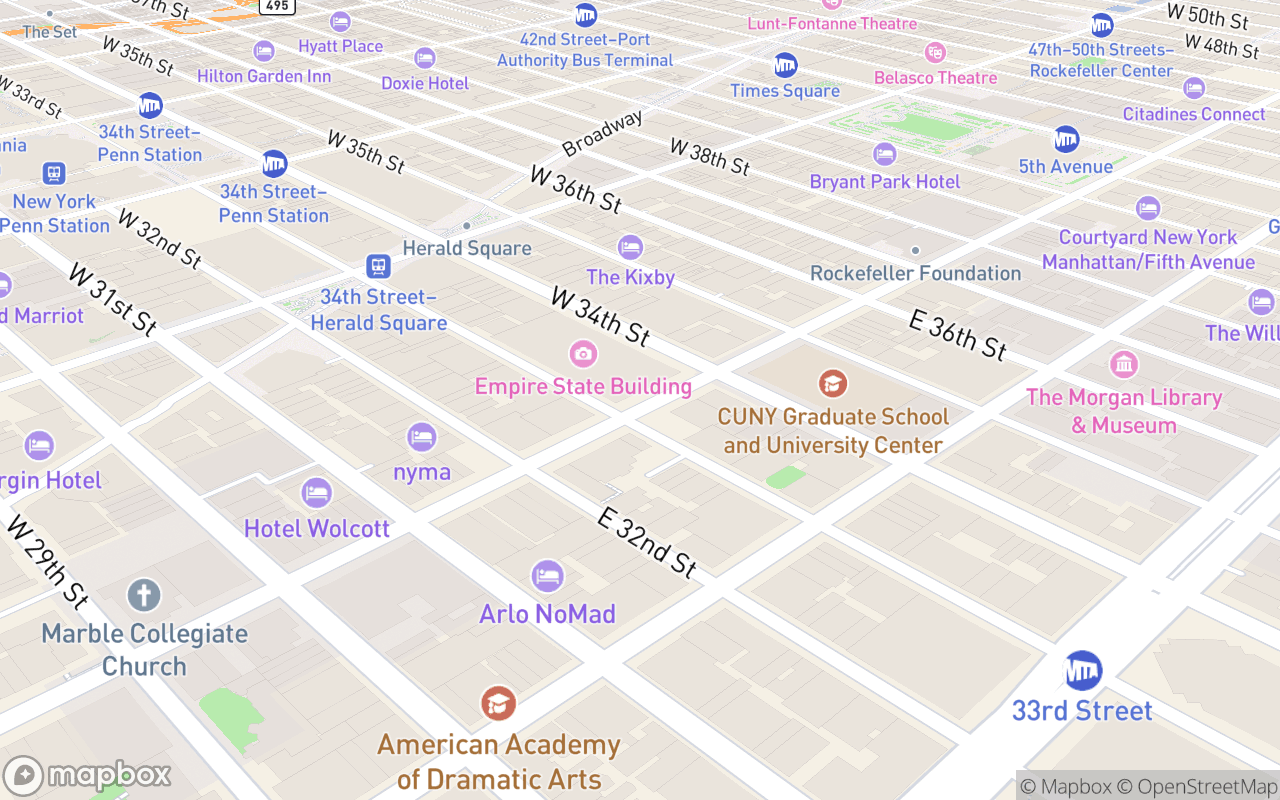
3D Extruded Buildings & Urban Footprints
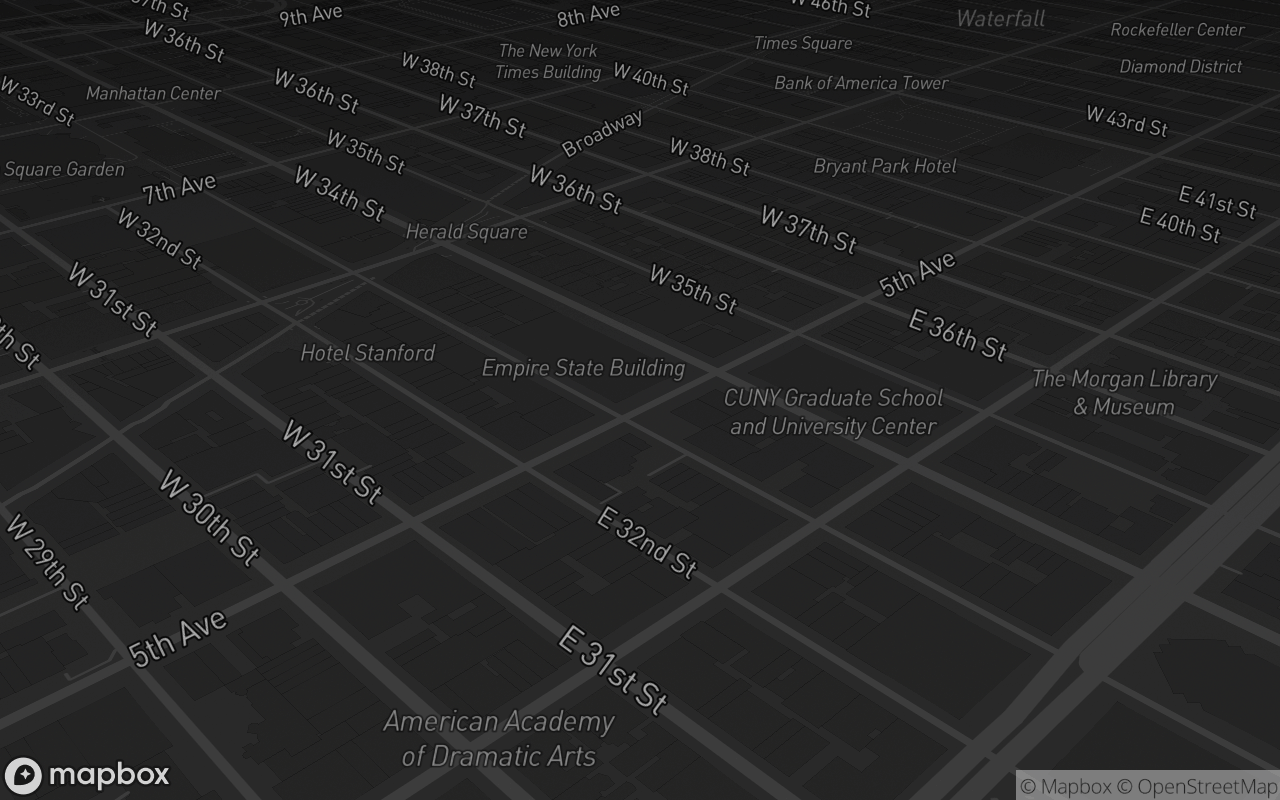
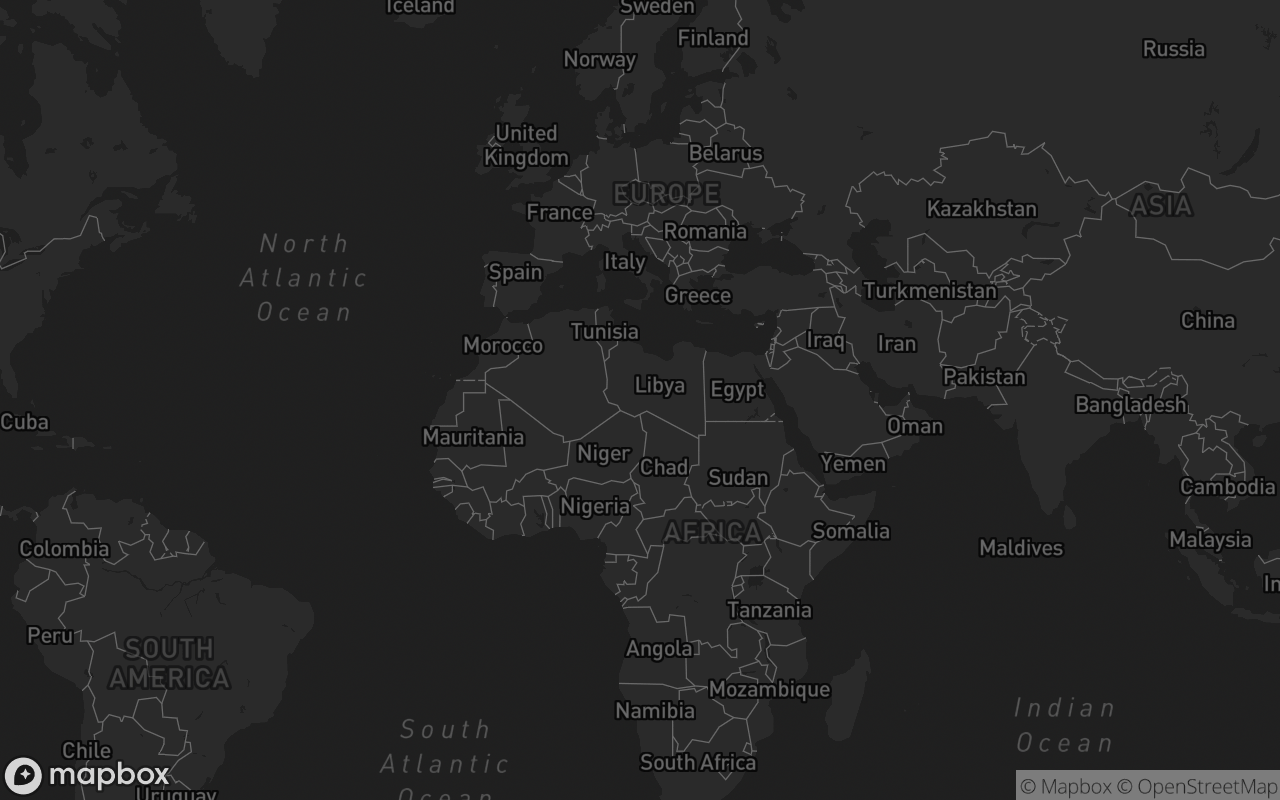
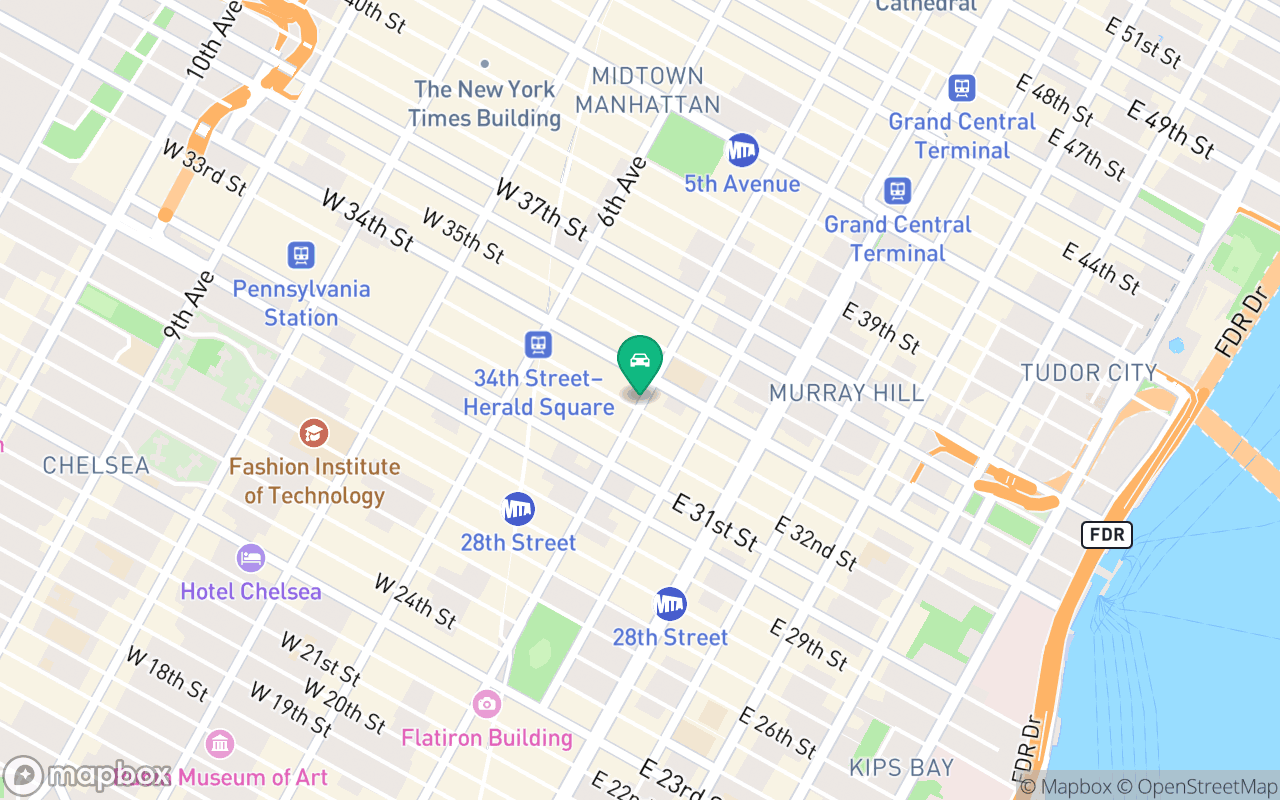
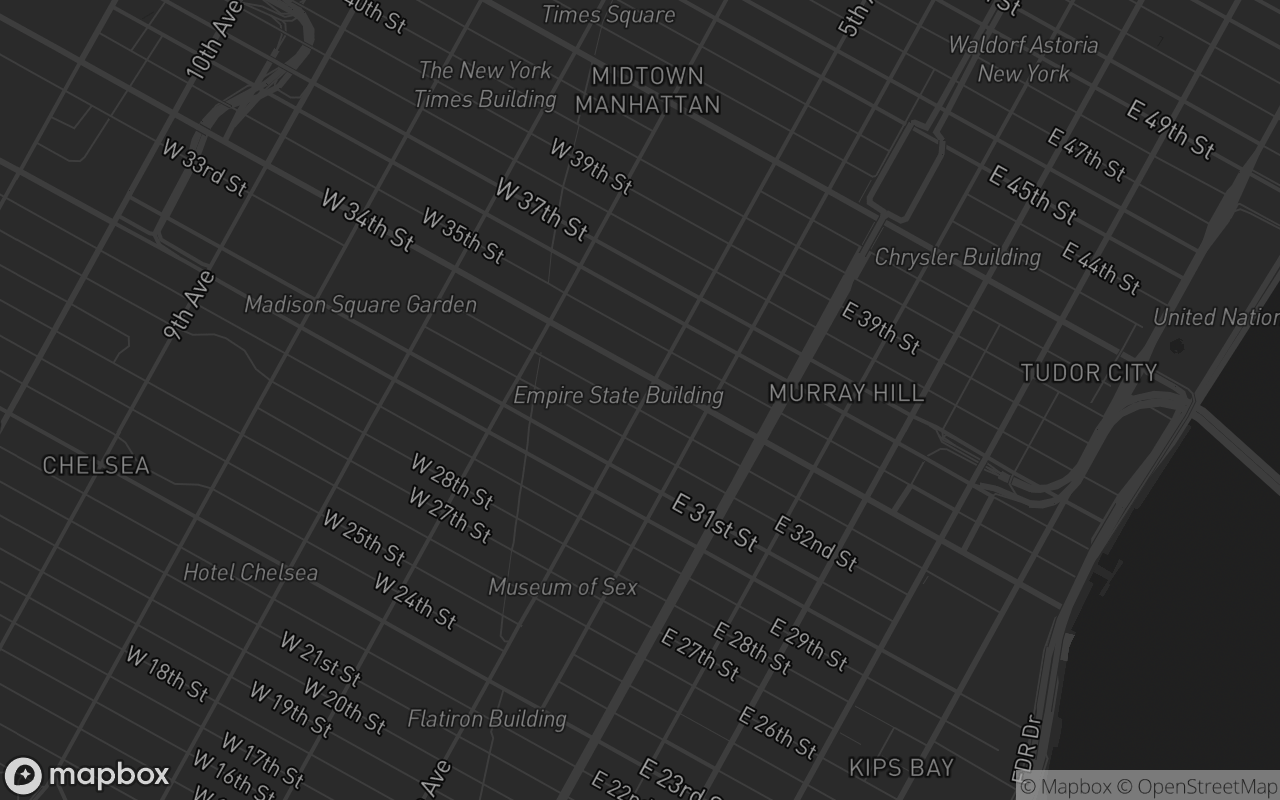
Real-world 3D building extrusions with dynamic sunlight shadows, terrain DEM elevations, and pitch/bearing camera controls.
progress-ring-chartuiReact mirror of @uipkge/progress-ring-chart — see the Vue registry item for the canonical description.
Also available for Vue ->$pnpm dlx shadcn@latest add https://uipkge.dev/r/react/progress-ring-chart.json$npx shadcn@latest add https://uipkge.dev/r/react/progress-ring-chart.json$yarn dlx shadcn@latest add https://uipkge.dev/r/react/progress-ring-chart.json$bunx shadcn@latest add https://uipkge.dev/r/react/progress-ring-chart.jsonnpx shadcn@latest add @uipkge-react/progress-ring-chartInstalls to:components/ui/charts/progress-ring-chart/| Name | Type / Values | Default | Required |
|---|---|---|---|
rings | ProgressRing[] | — | required |
height | number | string | — | optional |
strokeRing thickness in SVG units. Default 14. | number | — | optional |
showLabelShow the centre label (first ring value or custom). Default true. | boolean | — | optional |
centerLabelCentre label override. | string | — | optional |
colors | string[] | — | optional |
className | string | — | optional |
ariaLabelAccessible name announced for the chart image. Defaults to "Chart". | string | — | optional |
Type aliases from this item's source — use them to shape the data you pass in.
ProgressRinginterface ProgressRing {
/** 0..100. */
value: number
/** Defaults to chart-1..N tokens. */
color?: string
label?: string
}'use client'
import * as React from 'react'
import { cn } from '@/lib/utils'
import { ChartFrame } from '../shared'
// ProgressRingChart — dependency-free SVG gauge
// ─────────────────────────────────────────────────────────────────────────
export interface ProgressRing {
/** 0..100. */
value: number
/** Defaults to chart-1..N tokens. */
color?: string
label?: string
}
export interface ProgressRingChartProps {
rings: ProgressRing[]
height?: number | string
/** Ring thickness in SVG units. Default 14. */
stroke?: number
/** Show the centre label (first ring value or custom). Default true. */
showLabel?: boolean
/** Centre label override. */
centerLabel?: string
colors?: string[]
className?: string
/** Accessible name announced for the chart image. Defaults to "Chart". */
ariaLabel?: string
}
const DEFAULT_COLORS = ['var(--chart-1)', 'var(--chart-2)', 'var(--chart-3)', 'var(--chart-4)', 'var(--chart-5)']
const C = 2 * Math.PI * 80
export const ProgressRingChart = React.forwardRef<HTMLDivElement, ProgressRingChartProps>(
(
{ rings, height = 220, stroke = 14, showLabel = true, centerLabel, colors = DEFAULT_COLORS, className, ariaLabel },
ref,
) => {
const arcs = rings.map((r, i) => {
const pct = Math.max(0, Math.min(100, r.value)) / 100
return {
dash: `${(pct * C).toFixed(1)} ${C.toFixed(1)}`,
color: r.color ?? colors[i % colors.length],
r: 80 - i * (stroke + 6),
value: r.value,
}
})
const view = 200 + (rings.length - 1) * (stroke + 6) * 2
const center = view / 2
const summary =
centerLabel ?? (rings.length === 1 ? `${Math.round(rings[0]?.value ?? 0)}%` : `${rings.length} rings`)
return (
<ChartFrame
ref={ref}
height={height}
className={cn('flex items-center justify-center', className)}
ariaLabel={
ariaLabel ||
`Progress ring chart: ${rings.map((r) => `${r.label ?? 'value'} ${Math.round(r.value)}%`).join(', ')}`
}
>
<svg viewBox={`0 0 ${view} ${view}`} className="aspect-square h-full max-h-full" role="presentation">
<g transform={`rotate(-90 ${center} ${center})`}>
{arcs.map((a, i) => (
<circle
key={`t${i}`}
cx={center}
cy={center}
r={a.r}
fill="none"
stroke="currentColor"
strokeWidth={stroke}
className="text-border"
opacity="0.35"
/>
))}
{arcs.map((a, i) => (
<circle
key={`v${i}`}
cx={center}
cy={center}
r={a.r}
fill="none"
stroke={a.color}
strokeWidth={stroke}
strokeLinecap="round"
strokeDasharray={a.dash}
/>
))}
</g>
{showLabel && (
<text
x={center}
y={center}
textAnchor="middle"
dominantBaseline="middle"
className="fill-foreground"
fontSize="26"
fontWeight="700"
>
{summary}
</text>
)}
</svg>
</ChartFrame>
)
},
)
ProgressRingChart.displayName = 'ProgressRingChart'
export { ProgressRingChart, type ProgressRingChartProps, type ProgressRing } from './ProgressRingChart'
'use client'
import * as React from 'react'
import * as echartsCore from 'echarts/core'
import { use } from 'echarts/core'
import { CanvasRenderer } from 'echarts/renderers'
import {
LineChart as EChartsLineChart,
BarChart as EChartsBarChart,
PieChart as EChartsPieChart,
ScatterChart as EChartsScatterChart,
EffectScatterChart as EChartsEffectScatter,
PictorialBarChart as EChartsPictorialBar,
RadarChart as EChartsRadarChart,
GaugeChart as EChartsGaugeChart,
HeatmapChart as EChartsHeatmap,
TreemapChart as EChartsTreemapChart,
FunnelChart as EChartsFunnelChart,
BoxplotChart as EChartsBoxplotChart,
CandlestickChart as EChartsCandlestickChart,
CustomChart as EChartsCustomChart,
ChordChart as EChartsChordChart,
MapChart as EChartsMapChart,
GraphChart as EChartsGraphChart,
ParallelChart as EChartsParallelChart,
SankeyChart as EChartsSankeyChart,
SunburstChart as EChartsSunburstChart,
ThemeRiverChart,
TreeChart as EChartsTreeChart,
} from 'echarts/charts'
import {
GridComponent,
PolarComponent,
TooltipComponent,
LegendComponent,
MarkLineComponent,
MarkAreaComponent,
MarkPointComponent,
GraphicComponent,
RadarComponent,
VisualMapComponent,
CalendarComponent,
DataZoomComponent,
ParallelComponent,
SingleAxisComponent,
TitleComponent,
} from 'echarts/components'
import ReactECharts from 'echarts-for-react/esm/core'
import { cn } from '@/lib/utils'
export function heightToStyle(height: number | string): string {
return /^\d+$/.test(String(height)) ? `${height}px` : String(height)
}
interface ChartFrameProps {
height: number | string
className?: string
/** Apply the accessible role/tabindex/focus-ring chrome. Some chart
* wrappers ship a bare `w-full` frame -- pass `false` for those. */
focusable?: boolean
/** Accessible name for role="img". Defaults to "Chart". */
ariaLabel?: string
}
/** Shared `<div>` wrapper around the ECharts canvas. */
export const ChartFrame = React.forwardRef<HTMLDivElement, ChartFrameProps & { children: React.ReactNode }>(
({ height, className, focusable = true, ariaLabel, children }, ref) => (
<div
ref={ref}
role="img"
aria-label={ariaLabel || 'Chart'}
tabIndex={focusable ? 0 : undefined}
style={{ height: heightToStyle(height) }}
className={
focusable
? cn('focus-visible:ring-ring w-full focus-visible:ring-2 focus-visible:outline-none', className)
: cn('w-full', className)
}
>
{children}
</div>
),
)
ChartFrame.displayName = 'ChartFrame'
/** ECharts canvas filling its parent frame. */
export function EChart({ option }: { option: any }) {
return (
<ReactECharts
echarts={echartsCore as any}
option={option}
notMerge
lazyUpdate
style={{ width: '100%', height: '100%' }}
/>
)
}
export const echartsCoreModule = echartsCore
// Register every chart type the wrappers need once at module load.
use([
CanvasRenderer,
EChartsLineChart,
EChartsBarChart,
EChartsPieChart,
EChartsScatterChart,
EChartsEffectScatter,
EChartsPictorialBar,
EChartsRadarChart,
EChartsGaugeChart,
EChartsHeatmap,
EChartsTreemapChart,
EChartsFunnelChart,
EChartsBoxplotChart,
EChartsCandlestickChart,
EChartsCustomChart,
EChartsChordChart,
EChartsMapChart,
EChartsGraphChart,
EChartsParallelChart,
EChartsSankeyChart,
EChartsSunburstChart,
ThemeRiverChart,
EChartsTreeChart,
GridComponent,
PolarComponent,
TooltipComponent,
LegendComponent,
MarkLineComponent,
MarkAreaComponent,
MarkPointComponent,
GraphicComponent,
RadarComponent,
VisualMapComponent,
CalendarComponent,
DataZoomComponent,
ParallelComponent,
SingleAxisComponent,
TitleComponent,
])
Raw manifest:https://uipkge.dev/r/react/progress-ring-chart.json