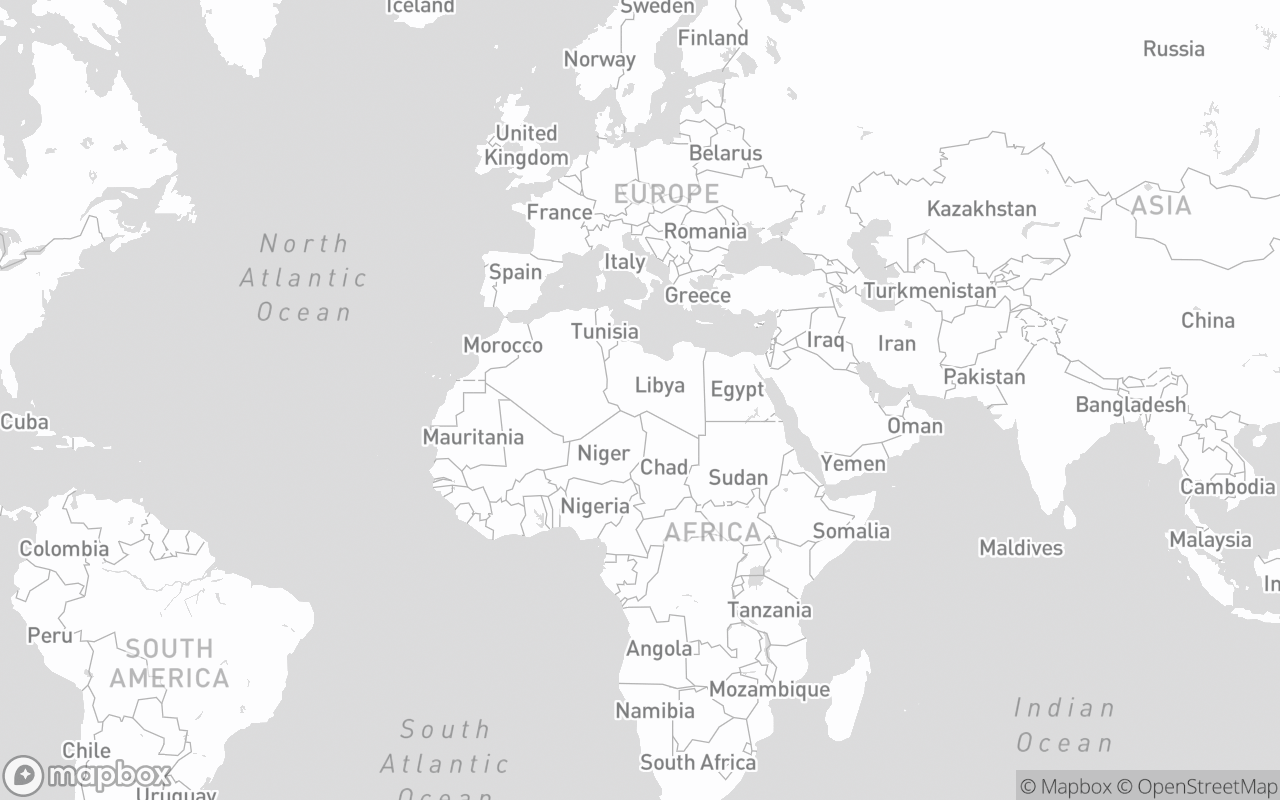
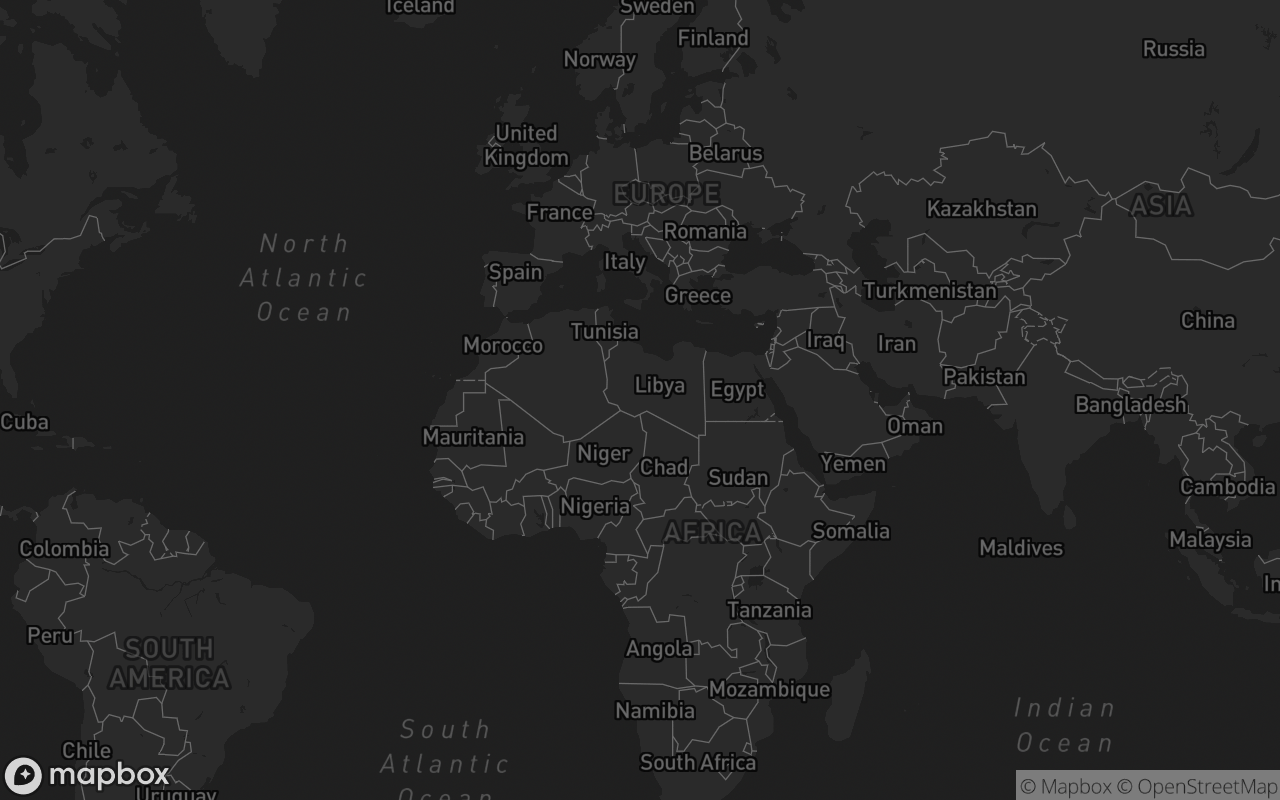
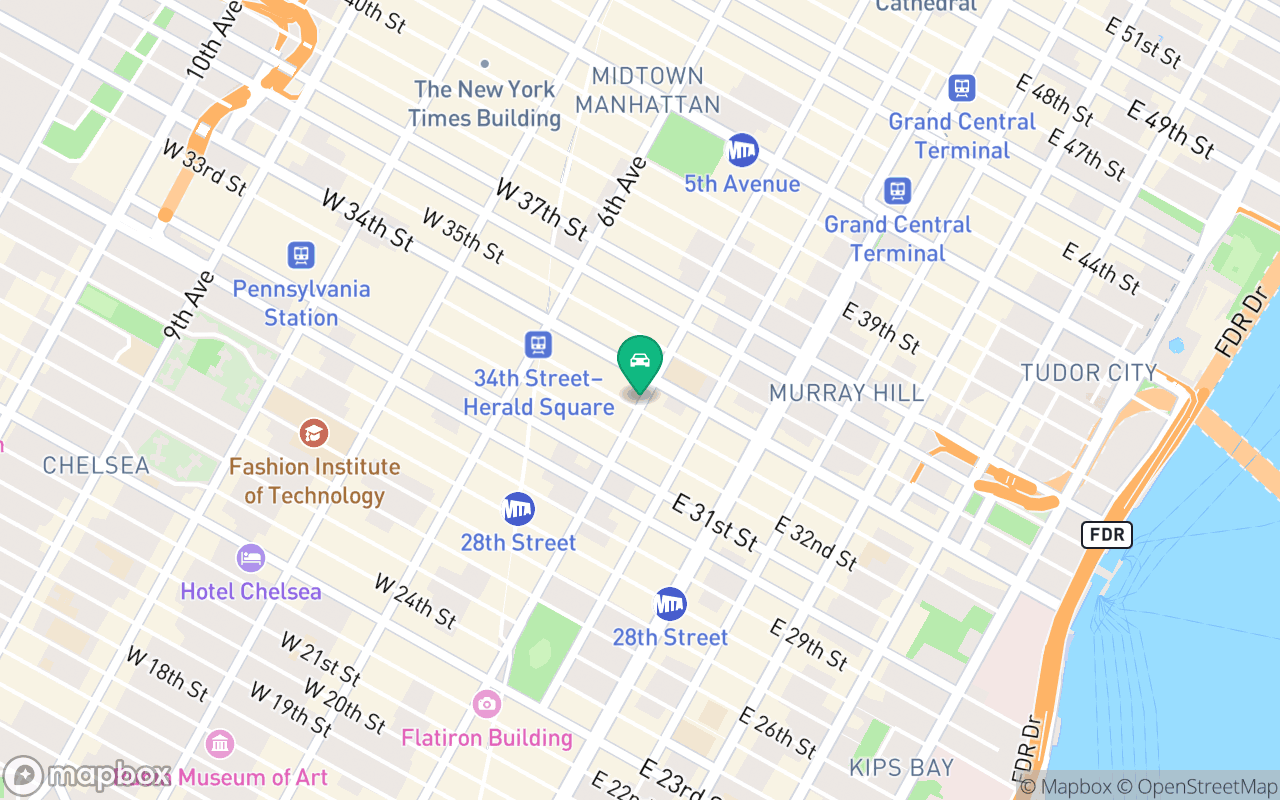
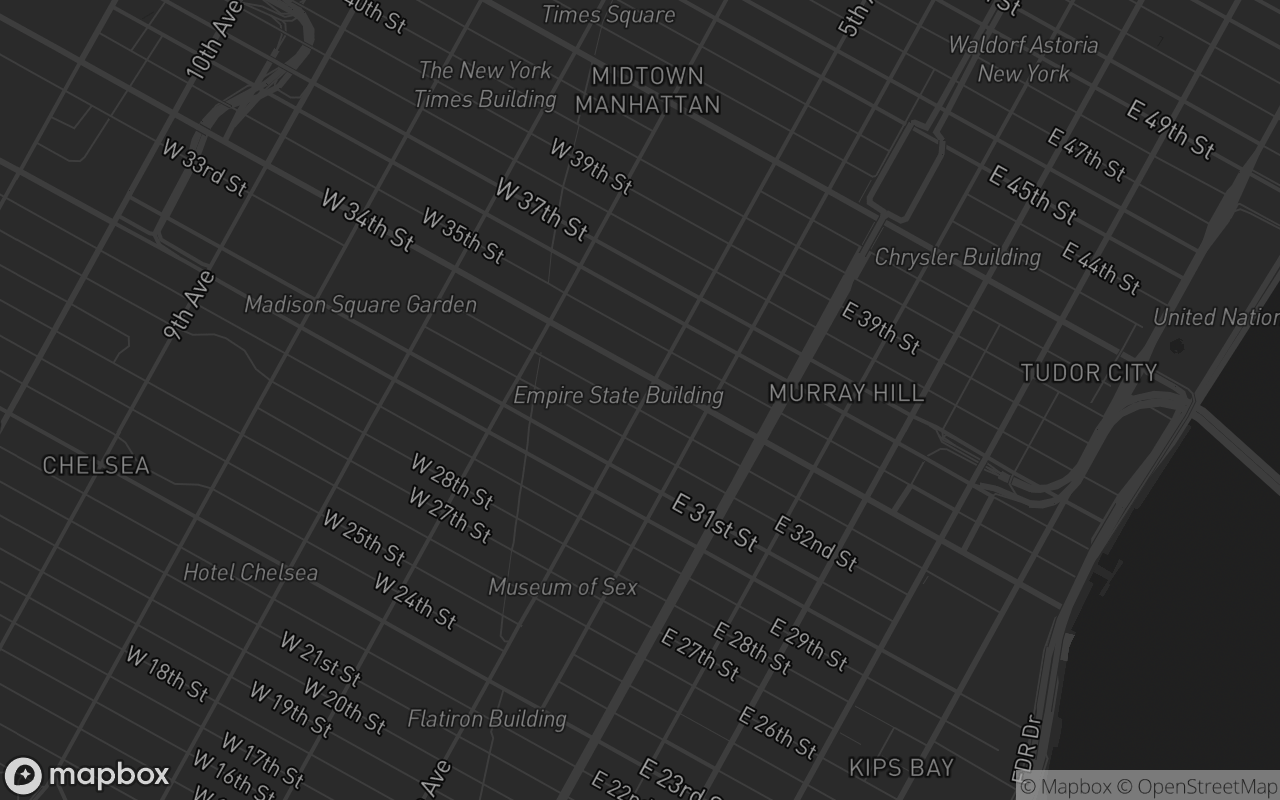
<script setup lang="ts">
import { computed, ref } from 'vue'
import type { HTMLAttributes } from 'vue'
import { Map, MapMarker, MapSource, MapLayer, type MapVariant } from '@/components/ui/map'
import { cn } from '@/lib/utils'
import { Globe } from 'lucide-vue-next'

export interface MapPin {
  lat: number
  lng: number
  label?: string
  color?: string
  description?: string
  value?: string | number
  status?: string
}

export interface MapRoute {
  from: { lat: number; lng: number }
  to: { lat: number; lng: number }
  color?: string
  width?: number
  curvature?: number
  animated?: boolean
  dashed?: boolean
  duration?: number
  label?: string
}

interface Props {
  pins?: MapPin[]
  routes?: MapRoute[]
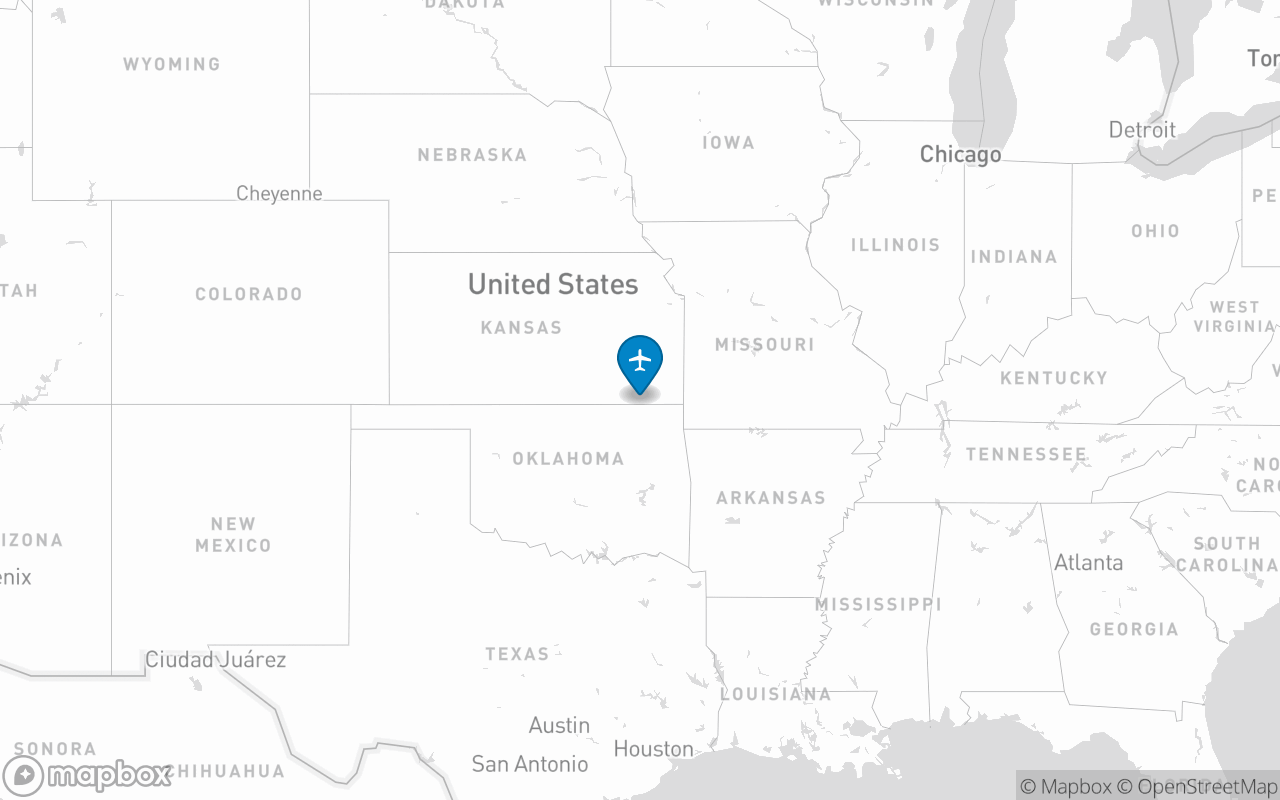
  map?: 'world' | 'usa'
  grid?: 'vertical' | 'diagonal'
  shape?: 'circle' | 'hexagon'
  dotColor?: string
  pulse?: boolean
  height?: number | string
  class?: HTMLAttributes['class']
  ariaLabel?: string
  interactive?: boolean
  variant?: MapVariant
  projection?: 'globe' | 'mercator'
}

const props = withDefaults(defineProps<Props>(), {
  pins: () => [],
  routes: () => [],
  map: 'world',
  grid: 'vertical',
  shape: 'circle',
  dotColor: 'rgba(255, 255, 255, 0.22)',
  pulse: true,
  height: 420,
  interactive: true,
  variant: 'dark',
  projection: 'globe',
})

const currentProjection = ref<'globe' | 'mercator'>(props.projection)
const emit = defineEmits<{
  (e: 'pin-click', pin: MapPin): void
  (e: 'pin-hover', pin: MapPin | null): void
}>()

const hoveredPin = ref<MapPin | null>(null)

function onPinEnter(pin: MapPin) {
  hoveredPin.value = pin
  emit('pin-hover', pin)
}

function onPinLeave() {
  hoveredPin.value = null
  emit('pin-hover', null)
}

function toggleProjection() {
  currentProjection.value = currentProjection.value === 'globe' ? 'mercator' : 'globe'
}

const mapCenter = computed<[number, number]>(() => {
  return props.map === 'usa' ? [-98, 39] : [0, 20]
})

const mapZoom = computed(() => {
  return props.map === 'usa' ? 3.5 : 1.5
})

// Generate synthetic telemetry dot matrix over land
const dotGridGeoJson = computed(() => {
  const features: any[] = []
  const step = props.map === 'usa' ? 3 : 6
  const latMin = props.map === 'usa' ? 25 : -55
  const latMax = props.map === 'usa' ? 50 : 70
  const lngMin = props.map === 'usa' ? -125 : -170
  const lngMax = props.map === 'usa' ? -66 : 170

  for (let lat = latMin; lat <= latMax; lat += step) {
    for (let lng = lngMin; lng <= lngMax; lng += step) {
      features.push({
        type: 'Feature',
        geometry: {
          type: 'Point',
          coordinates: [lng, lat],
        },
      })
    }
  }

  return {
    type: 'FeatureCollection',
    features,
  }
})

const routesGeoJson = computed(() => {
  if (!props.routes || !props.routes.length) return null
  return {
    type: 'FeatureCollection',
    features: props.routes.map((r, i) => ({
      type: 'Feature',
      id: i,
      properties: {
        color: r.color || 'rgba(56, 189, 248, 0.75)',
        dashed: r.dashed ?? true,
      },
      geometry: {
        type: 'LineString',
        coordinates: [
          [r.from.lng, r.from.lat],
          [(r.from.lng + r.to.lng) / 2, (r.from.lat + r.to.lat) / 2 + 5],
          [r.to.lng, r.to.lat],
        ],
      },
    })),
  }
})

const dotPaint = computed(() => ({
  'circle-radius': 1.5,
  'circle-color': props.dotColor || 'rgba(255, 255, 255, 0.22)',
  'circle-opacity': 0.4,
}))

const routeLinePaint = {
  'line-color': ['get', 'color'],
  'line-width': 1.5,
  'line-dasharray': [2, 2],
}
</script>

<template>
  <div
    :class="cn('border-border bg-card group relative w-full overflow-hidden rounded-xl border shadow-xs', props.class)"
    :style="{
      height:
        typeof props.height === 'number'
          ? `${props.height}px`
          : /^\d+$/.test(String(props.height))
            ? `${props.height}px`
            : props.height,
    }"
  >
    <Map :variant="variant" :projection="currentProjection" :center="mapCenter" :zoom="mapZoom" class="size-full">
      <!-- Telemetry Dot Grid -->
      <MapSource id="dot-grid-source" type="geojson" :data="dotGridGeoJson">
        <MapLayer id="dot-grid-layer" type="circle" :paint="dotPaint" />
      </MapSource>

      <!-- Connection Routes -->
      <MapSource v-if="routesGeoJson" id="routes-source" type="geojson" :data="routesGeoJson">
        <MapLayer id="routes-layer" type="line" :paint="routeLinePaint" />
      </MapSource>

      <!-- Pins -->
      <MapMarker
        v-for="(pin, i) in pins"
        :key="i"
        :lng-lat="[pin.lng, pin.lat]"
        anchor="center"
        class="cursor-pointer select-none"
      >
        <div
          class="relative flex size-6 items-center justify-center"
          @mouseenter="onPinEnter(pin)"
          @mouseleave="onPinLeave"
          @click="emit('pin-click', pin)"
        >
          <span
            v-if="pulse"
            class="absolute inline-flex size-full animate-ping rounded-full opacity-60"
            :style="{ backgroundColor: pin.color || 'oklch(0.65 0.20 145)' }"
          />
          <span
            class="ring-background relative inline-flex size-2.5 rounded-full shadow-xs ring-2"
            :style="{
              backgroundColor: pin.color || 'oklch(0.65 0.20 145)',
              boxShadow: `0 0 10px ${pin.color || 'oklch(0.65 0.20 145)'}`,
            }"
          />
        </div>
      </MapMarker>
    </Map>

    <!-- Projection Switcher -->
    <div
      class="border-border/70 bg-card/85 absolute top-3 right-3 z-10 flex items-center gap-1 rounded-lg border p-1 shadow-xs backdrop-blur-md"
    >
      <button
        type="button"
        class="text-muted-foreground hover:bg-muted hover:text-foreground flex items-center gap-1.5 rounded-md px-2.5 py-1 text-xs font-medium transition"
        @click="toggleProjection"
      >
        <Globe class="size-3.5" />
        <span class="capitalize">{{ currentProjection }}</span>
      </button>
    </div>

    <!-- Active Pin Card -->
    <div
      v-if="hoveredPin && interactive"
      class="border-border/80 bg-card/95 animate-in fade-in slide-in-from-bottom-2 absolute bottom-3 left-3 z-10 max-w-xs rounded-xl border p-3 shadow-lg backdrop-blur-md duration-150"
    >
      <div class="flex items-center gap-2">
        <span class="size-2 rounded-full" :style="{ backgroundColor: hoveredPin.color || 'oklch(0.65 0.20 145)' }" />
        <h5 class="text-foreground text-xs font-semibold">
          {{ hoveredPin.label || 'Telemetry Node' }}
        </h5>
      </div>
      <p v-if="hoveredPin.description" class="text-muted-foreground mt-1 text-xs">
        {{ hoveredPin.description }}
      </p>
      <div
        v-if="hoveredPin.value !== undefined"
        class="border-border/60 mt-2 flex items-baseline justify-between border-t pt-1.5 font-mono text-xs"
      >
        <span class="text-muted-foreground">Value</span>
        <span class="text-foreground font-semibold">{{ hoveredPin.value }}</span>
      </div>
    </div>
  </div>
</template>