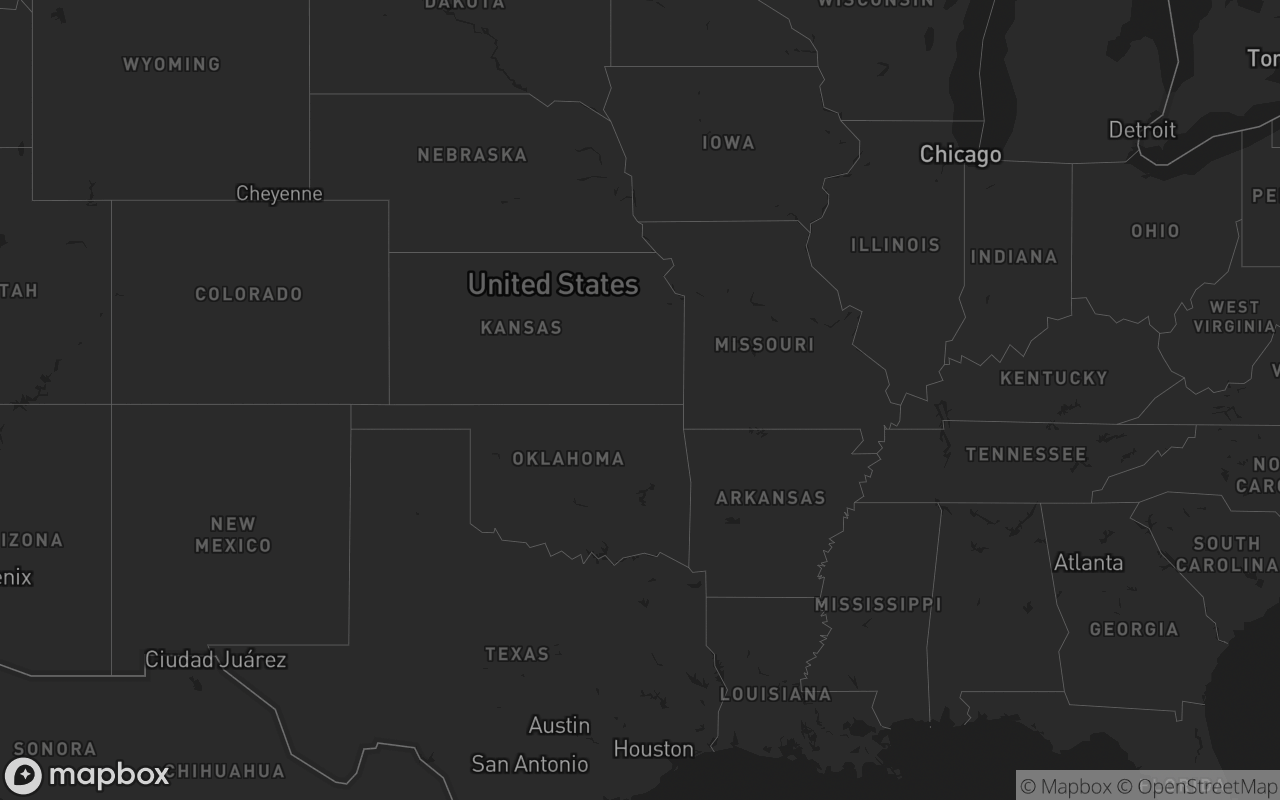
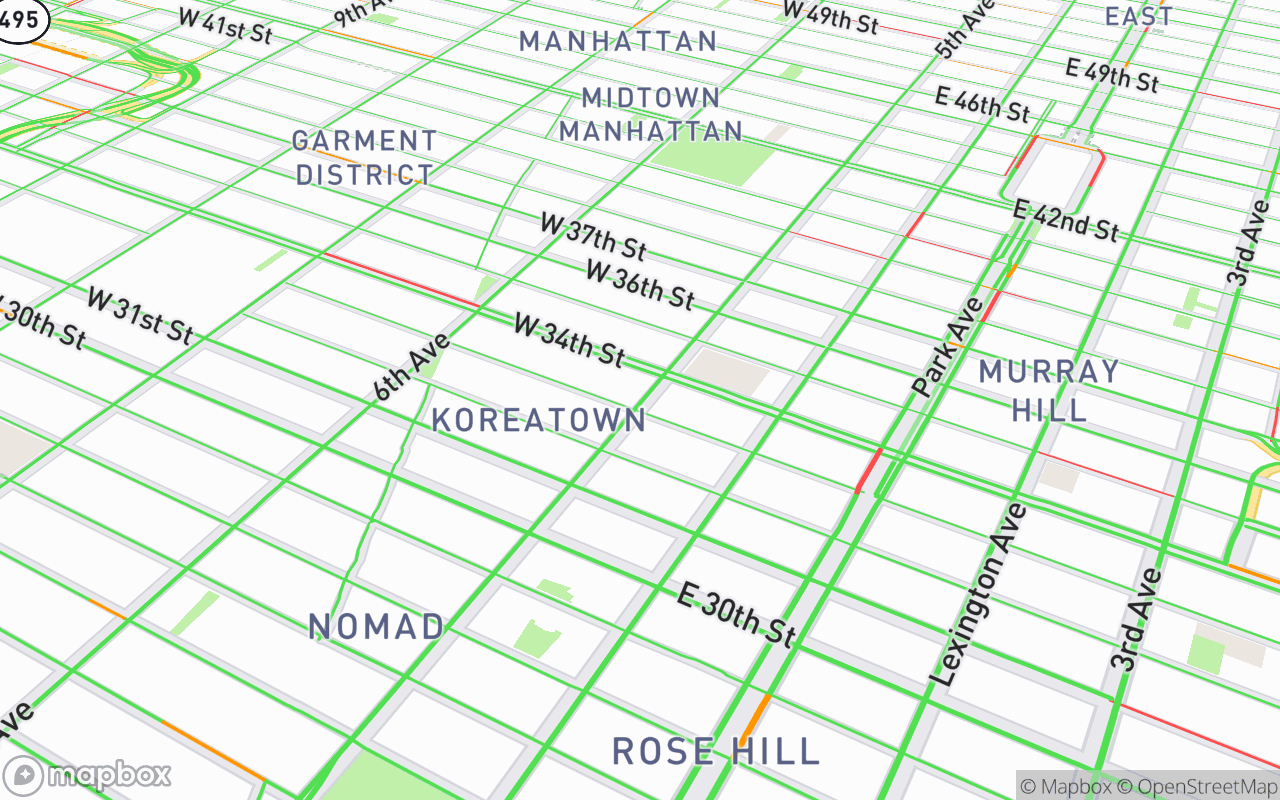
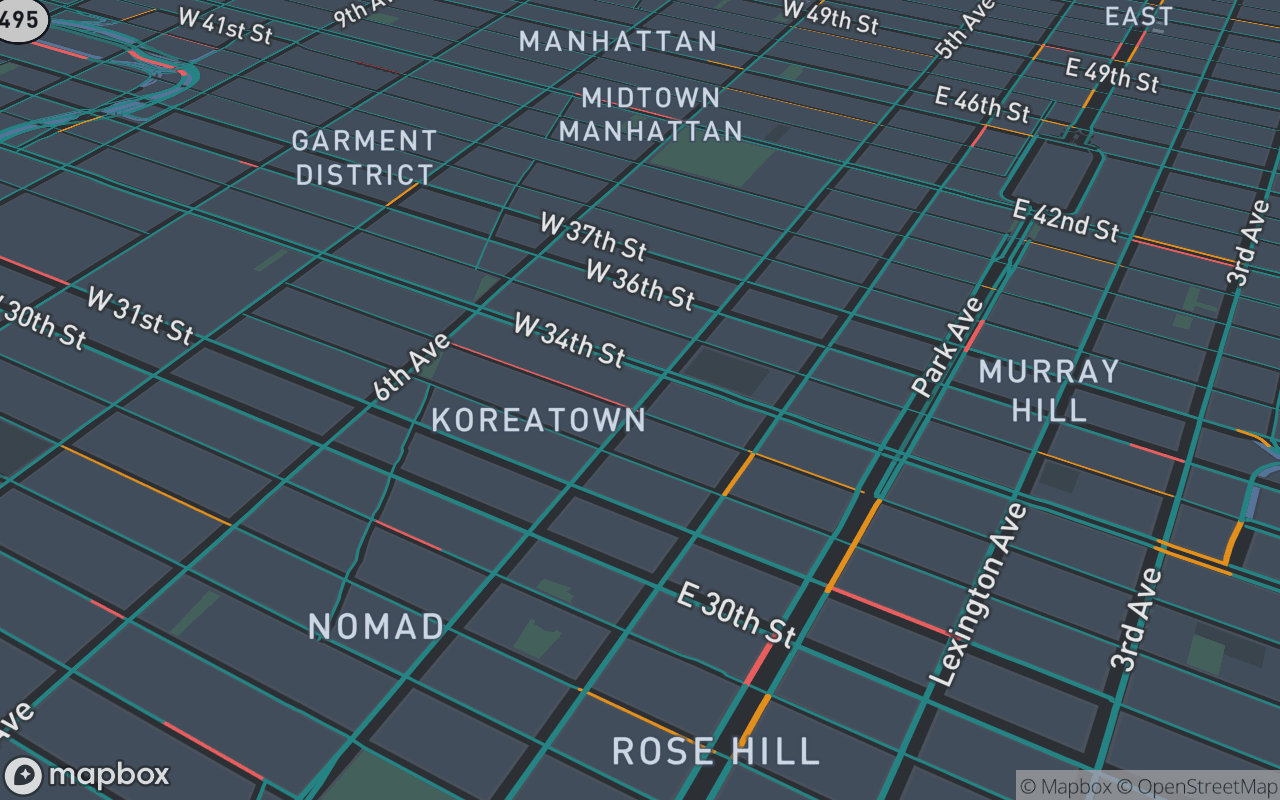
3D Extruded Buildings & Urban Footprints
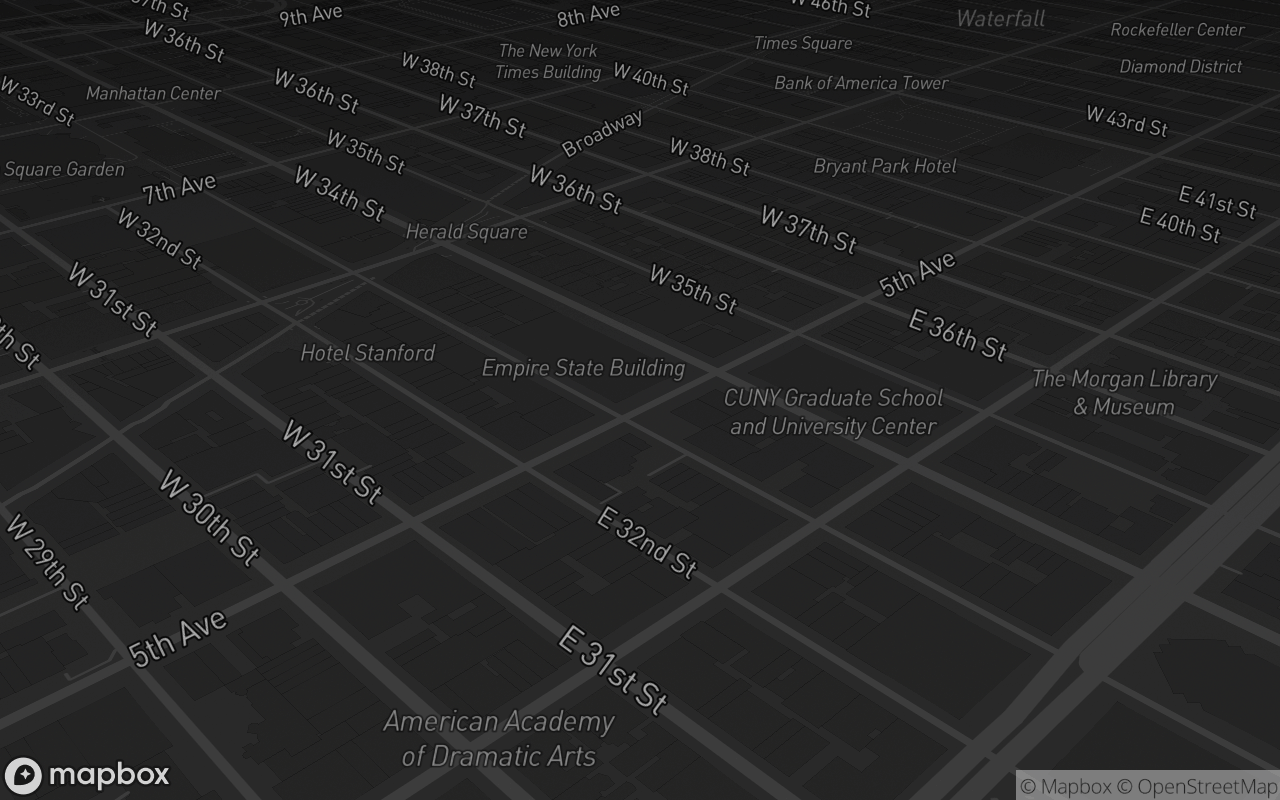
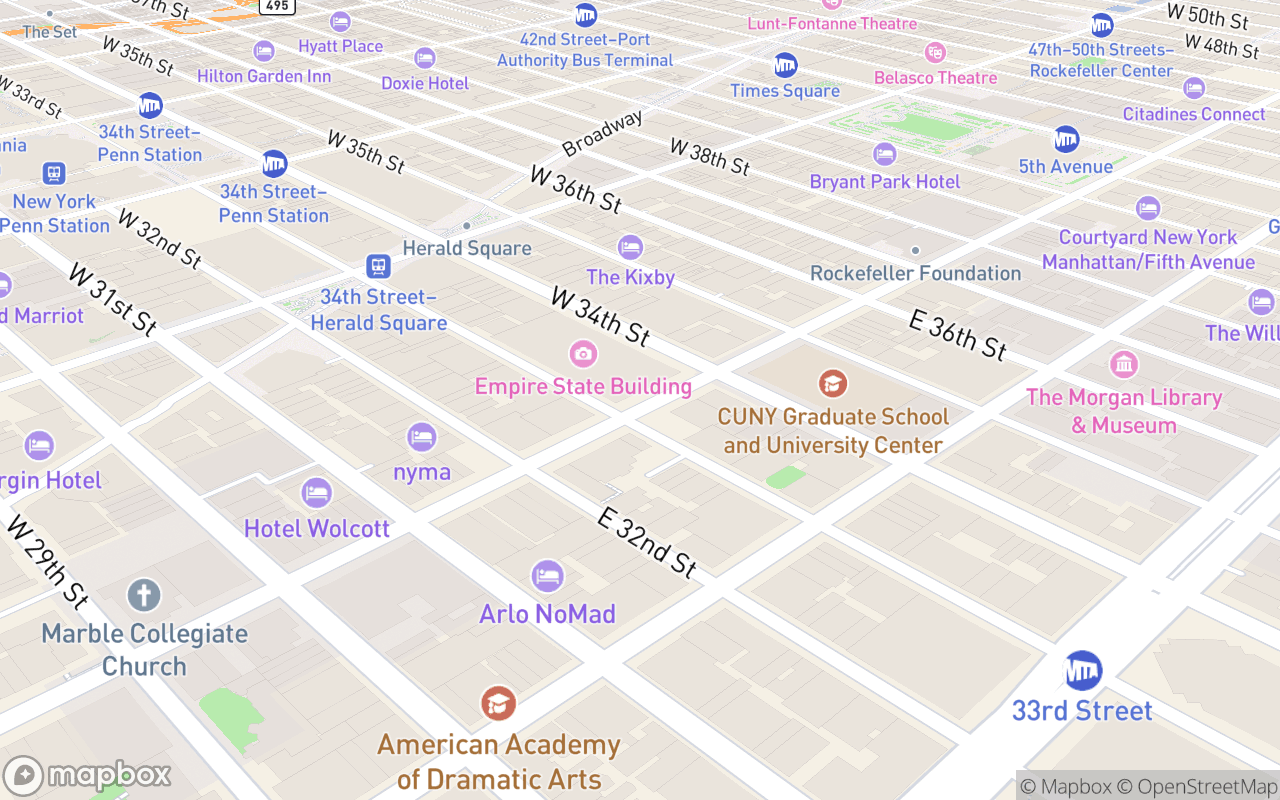
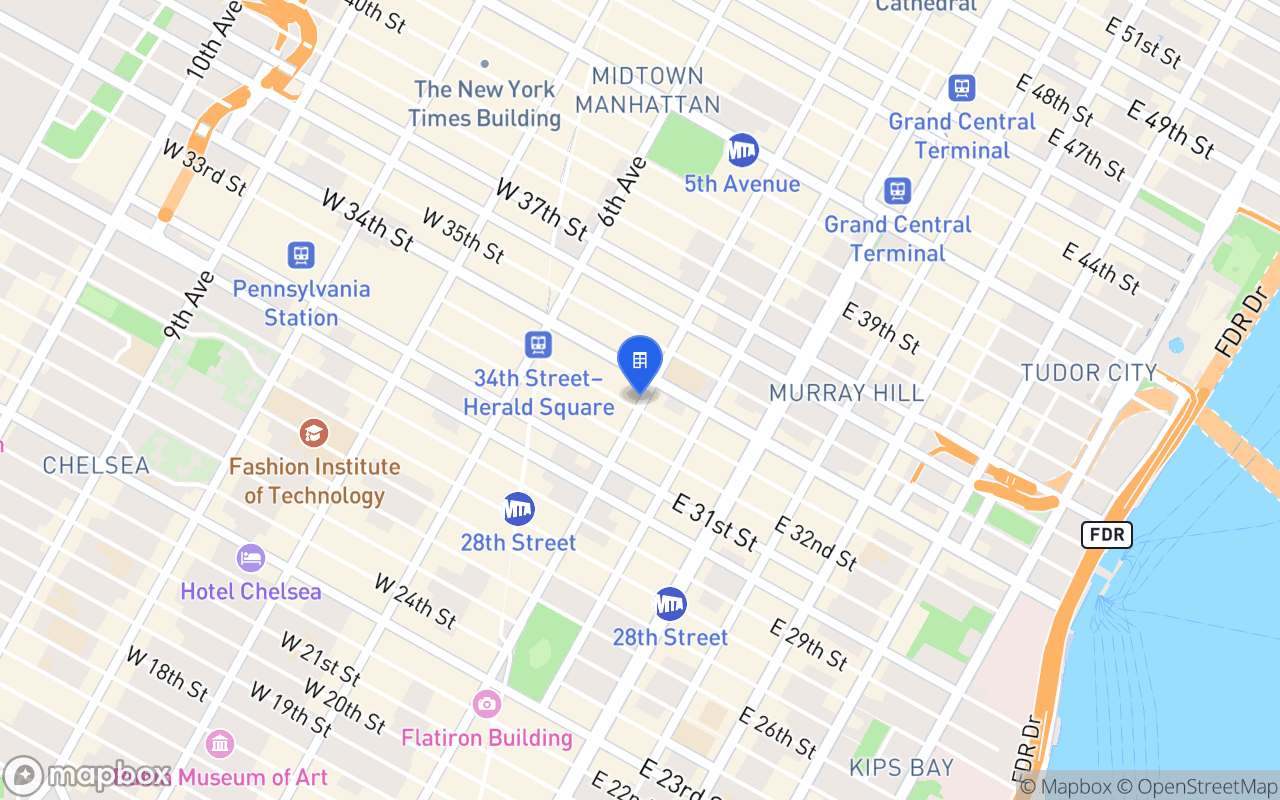
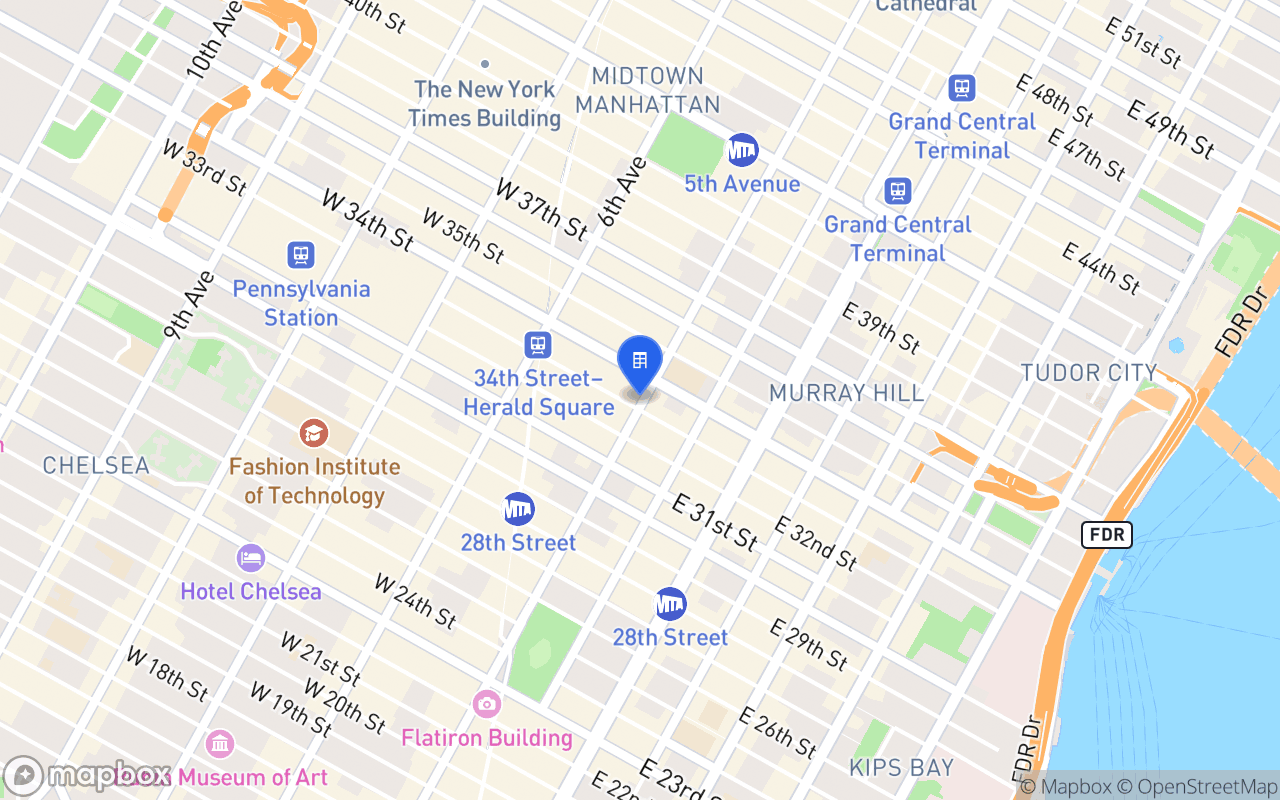
Real-world 3D building extrusions with dynamic sunlight shadows, terrain DEM elevations, and pitch/bearing camera controls.
Customer-proof set pairing a featured split story with a sticky results panel, a filterable story index, three-up metric cards, a before-and-after metric comparison table, and a compact results strip.
Also available for React ->$pnpm dlx shadcn-vue@latest add https://uipkge.dev/r/vue/case-study.json$npx shadcn-vue@latest add https://uipkge.dev/r/vue/case-study.json$yarn dlx shadcn-vue@latest add https://uipkge.dev/r/vue/case-study.json$bunx shadcn-vue@latest add https://uipkge.dev/r/vue/case-study.jsonnpx shadcn-vue@latest add @uipkge/case-studyInstalls to:app/components/blocks/case-study/<script setup lang="ts">
import { ArrowRight, Quote } from 'lucide-vue-next'
import { Avatar, AvatarFallback } from '@/components/ui/avatar'
import { Badge } from '@/components/ui/badge'
import { Button } from '@/components/ui/button'
import { Card, CardContent } from '@/components/ui/card'
import { Separator } from '@/components/ui/separator'
const results = [
{ value: '5 days', label: 'off the monthly close' },
{ value: '11 → 1', label: 'reconciliation spreadsheets' },
{ value: '340', label: 'certified metrics published' },
{ value: '6 weeks', label: 'kickoff to full hand-over' },
]
const facts = [
{ term: 'Industry', detail: 'Freight forwarding' },
{ term: 'Size', detail: '1,200 staff · 18 countries' },
{ term: 'Stack', detail: 'Snowflake · dbt · Okta' },
{ term: 'Live since', detail: 'Q1 2026' },
]
</script>
<template>
<section data-slot="case-study-featured-story" class="bg-background">
<div class="mx-auto max-w-6xl px-6 py-20 lg:py-28">
<div class="grid gap-12 lg:grid-cols-[1.4fr_1fr] lg:gap-16">
<article>
<Badge variant="secondary">Case study</Badge>
<h2 class="mt-4 text-3xl font-semibold tracking-tight text-balance sm:text-4xl">
How Northwind Logistics closed the books five days early
</h2>
<div class="mt-8 space-y-8">
<div>
<h3 class="text-muted-foreground font-mono text-xs tracking-[0.14em] uppercase">The challenge</h3>
<p class="mt-2.5 leading-relaxed">
Month-end ran on eleven spreadsheets maintained by four people across three time zones. Every close
opened with a reconciliation pass nobody had budgeted for, and restatements were tracked in email.
</p>
</div>
<div>
<h3 class="text-muted-foreground font-mono text-xs tracking-[0.14em] uppercase">The approach</h3>
<p class="mt-2.5 leading-relaxed">
We mirrored the warehouse schema, rebuilt revenue and margin as versioned definitions, and reconciled
them against the prior four quarters before anything was published. A single regional team piloted the
first close; the rest of finance moved over two weeks later.
</p>
</div>
<div>
<h3 class="text-muted-foreground font-mono text-xs tracking-[0.14em] uppercase">The result</h3>
<p class="mt-2.5 leading-relaxed">
Close now starts from a reconciled position. Restatements open a reviewable change instead of a thread,
and the audit pack is generated from the same history.
</p>
</div>
</div>
<figure class="border-border mt-10 border-l-2 pl-6">
<Quote class="text-muted-foreground/60 size-5" aria-hidden="true" />
<blockquote class="mt-3 text-lg leading-snug font-medium text-balance">
We stopped arguing about whose number was right and started arguing about what to do next. That is the
whole change, and it was worth the six weeks.
</blockquote>
<figcaption class="mt-5 flex items-center gap-3">
<Avatar class="size-9">
<AvatarFallback class="text-xs">EW</AvatarFallback>
</Avatar>
<div>
<p class="text-sm font-medium">Erin Walsh</p>
<p class="text-muted-foreground text-xs">VP Finance, Northwind Logistics</p>
</div>
</figcaption>
</figure>
<Button class="mt-10">
Read the full story
<ArrowRight class="ml-2 size-4" aria-hidden="true" />
</Button>
</article>
<!-- Sticky results panel: keeps the numbers in view while the narrative scrolls. -->
<aside class="lg:sticky lg:top-24 lg:self-start">
<Card>
<CardContent class="p-6">
<h3 class="text-muted-foreground font-mono text-xs tracking-[0.14em] uppercase">Results</h3>
<dl class="mt-5 grid grid-cols-2 gap-x-4 gap-y-6">
<div v-for="result in results" :key="result.label">
<dt class="sr-only">{{ result.label }}</dt>
<dd>
<span class="font-display block text-2xl font-bold tracking-tight">{{ result.value }}</span>
<span class="text-muted-foreground mt-1 block text-xs leading-snug">{{ result.label }}</span>
</dd>
</div>
</dl>
<Separator class="my-6" />
<dl class="space-y-3">
<div v-for="fact in facts" :key="fact.term" class="flex items-baseline justify-between gap-4 text-sm">
<dt class="text-muted-foreground">{{ fact.term }}</dt>
<dd class="text-right font-medium">{{ fact.detail }}</dd>
</div>
</dl>
</CardContent>
</Card>
</aside>
</div>
</div>
</section>
</template>
<script setup lang="ts">
import { computed, ref } from 'vue'
import { ArrowUpRight } from 'lucide-vue-next'
import { Badge } from '@/components/ui/badge'
import { Button } from '@/components/ui/button'
import { Card, CardContent } from '@/components/ui/card'
import { Separator } from '@/components/ui/separator'
import { ToggleGroup, ToggleGroupItem } from '@/components/ui/toggle-group'
const studies = [
{
company: 'Northwind Logistics',
industry: 'Logistics',
result: '5 days off the monthly close',
stack: 'Snowflake · dbt · Okta',
readTime: '8 min',
},
{
company: 'Halden Health',
industry: 'Healthcare',
result: '71% fewer ad-hoc data requests',
stack: 'BigQuery · Airflow',
readTime: '6 min',
},
{
company: 'Verity Retail Group',
industry: 'Retail',
result: '2.4pp tighter forecast band',
stack: 'Redshift · dbt',
readTime: '7 min',
},
{
company: 'Calder Manufacturing',
industry: 'Manufacturing',
result: '11 spreadsheets retired',
stack: 'Postgres · Dagster',
readTime: '5 min',
},
{
company: 'Ridgeway Freight',
industry: 'Logistics',
result: 'Per-shipment landed cost',
stack: 'Snowflake · Fivetran',
readTime: '9 min',
},
{
company: 'Ashford Clinics',
industry: 'Healthcare',
result: 'PHI-scoped self-serve reporting',
stack: 'BigQuery · Entra ID',
readTime: '6 min',
},
]
const ALL = 'All'
const industries = computed(() => [ALL, ...new Set(studies.map((study) => study.industry))])
const active = ref(ALL)
const visible = computed(() =>
active.value === ALL ? studies : studies.filter((study) => study.industry === active.value),
)
// Single-select emits '' when the pressed chip is pressed again; fall back to
// ALL so the list is never empty by accident.
function onChange(value: unknown) {
active.value = typeof value === 'string' && value ? value : ALL
}
</script>
<template>
<section data-slot="case-study-filterable-list" class="bg-background">
<div class="mx-auto max-w-4xl px-6 py-20 lg:py-28">
<div class="flex flex-wrap items-end justify-between gap-6">
<div>
<Badge variant="secondary">Customer stories</Badge>
<h2 class="mt-4 text-3xl font-semibold tracking-tight sm:text-4xl">Read one close to your own</h2>
</div>
<ToggleGroup
:model-value="active"
type="single"
variant="outline"
size="sm"
class="flex-nowrap overflow-x-auto"
aria-label="Filter case studies by industry"
@update:model-value="onChange"
>
<ToggleGroupItem v-for="industry in industries" :key="industry" :value="industry">
{{ industry }}
</ToggleGroupItem>
</ToggleGroup>
</div>
<Card class="mt-8">
<CardContent class="p-2">
<div v-if="!visible.length" class="px-4 py-16 text-center">
<p class="text-sm font-medium">No stories in that industry yet.</p>
<Button variant="outline" size="sm" class="mt-4" @click="active = ALL">Show all</Button>
</div>
<ul v-else>
<li v-for="(study, index) in visible" :key="study.company">
<a
href="#"
class="hover:bg-muted focus-visible:ring-ring group flex items-center gap-4 rounded-lg p-4 transition-colors focus-visible:ring-2 focus-visible:outline-none"
>
<div class="min-w-0 flex-1">
<div class="flex flex-wrap items-center gap-2">
<p class="text-sm font-semibold">{{ study.company }}</p>
<Badge variant="outline">{{ study.industry }}</Badge>
</div>
<p class="mt-1 text-sm">{{ study.result }}</p>
<p class="text-muted-foreground mt-1 font-mono text-xs">{{ study.stack }}</p>
</div>
<span class="text-muted-foreground shrink-0 text-xs">{{ study.readTime }}</span>
<ArrowUpRight
class="text-muted-foreground size-4 shrink-0 transition-transform group-hover:translate-x-0.5 group-hover:-translate-y-0.5"
aria-hidden="true"
/>
</a>
<Separator v-if="index < visible.length - 1" />
</li>
</ul>
</CardContent>
</Card>
</div>
</section>
</template>
<script setup lang="ts">
import { ArrowUpRight } from 'lucide-vue-next'
import { Avatar, AvatarFallback } from '@/components/ui/avatar'
import { Badge } from '@/components/ui/badge'
import { Button } from '@/components/ui/button'
import { Card, CardContent } from '@/components/ui/card'
import { Separator } from '@/components/ui/separator'
const studies = [
{
metric: '5 days',
metricLabel: 'off the monthly close',
company: 'Northwind Logistics',
industry: 'Freight forwarding · 1,200 staff',
outcome: 'Replaced eleven reconciliation spreadsheets with one certified revenue model.',
quote: 'We stopped arguing about whose number was right and started arguing about what to do next.',
author: { name: 'Erin Walsh', role: 'VP Finance', initials: 'EW' },
},
{
metric: '71%',
metricLabel: 'fewer ad-hoc data requests',
company: 'Halden Health',
industry: 'Provider network · 40 clinics',
outcome: 'Clinic leads self-serve their own quality metrics without filing a ticket.',
quote: 'The analytics team went from a request queue to actually building things again.',
author: { name: 'Daniel Brooks', role: 'Head of Analytics', initials: 'DB' },
},
{
metric: '2.4pp',
metricLabel: 'tighter forecast accuracy',
company: 'Verity Retail Group',
industry: 'Omnichannel retail · 310 stores',
outcome: 'Sales and finance now forecast off the same pipeline definition, snapshotted weekly.',
quote: 'Forecast review stopped opening with twenty minutes of reconciling two decks.',
author: { name: 'Priya Raman', role: 'RevOps Director', initials: 'PR' },
},
]
</script>
<template>
<section data-slot="case-study-metric-cards" class="bg-background">
<div class="mx-auto max-w-6xl px-6 py-20 lg:py-28">
<div class="flex flex-wrap items-end justify-between gap-6">
<div class="max-w-2xl">
<Badge variant="secondary">Customer results</Badge>
<h2 class="mt-4 text-3xl font-semibold tracking-tight sm:text-4xl">What changed after the rollout</h2>
<p class="text-muted-foreground mt-3 text-lg">
Three teams, measured against their own numbers from the quarter before.
</p>
</div>
<Button variant="outline">All case studies</Button>
</div>
<div class="mt-10 grid gap-4 md:grid-cols-3">
<Card v-for="study in studies" :key="study.company" class="group">
<CardContent class="flex h-full flex-col p-6">
<!-- Metric leads: it is the only part that survives a skim. -->
<p class="font-display text-4xl font-bold tracking-tight">{{ study.metric }}</p>
<p class="text-muted-foreground mt-1 text-sm">{{ study.metricLabel }}</p>
<Separator class="my-5" />
<p class="text-sm font-semibold">{{ study.company }}</p>
<p class="text-muted-foreground mt-0.5 text-xs">{{ study.industry }}</p>
<p class="mt-4 text-sm leading-relaxed">{{ study.outcome }}</p>
<blockquote class="border-border text-muted-foreground mt-5 border-l-2 pl-4 text-sm italic">
“{{ study.quote }}”
</blockquote>
<div class="mt-auto flex items-center gap-3 pt-6">
<Avatar class="size-8">
<AvatarFallback class="text-xs">{{ study.author.initials }}</AvatarFallback>
</Avatar>
<div class="min-w-0">
<p class="truncate text-sm font-medium">{{ study.author.name }}</p>
<p class="text-muted-foreground truncate text-xs">{{ study.author.role }}</p>
</div>
<Button variant="ghost" size="icon" class="ml-auto" :aria-label="`Read the ${study.company} case study`">
<ArrowUpRight
class="size-4 transition-transform group-hover:translate-x-0.5 group-hover:-translate-y-0.5"
aria-hidden="true"
/>
</Button>
</div>
</CardContent>
</Card>
</div>
</div>
</section>
</template>
<script setup lang="ts">
import { ArrowRight, TrendingDown, TrendingUp } from 'lucide-vue-next'
import { Badge } from '@/components/ui/badge'
import { Button } from '@/components/ui/button'
import { Card, CardContent } from '@/components/ui/card'
import { Separator } from '@/components/ui/separator'
import { Table, TableBody, TableCell, TableHead, TableHeader, TableRow } from '@/components/ui/table'
// `better` records which direction is good, so the delta colour never has to be
// hard-coded per row — a falling close time is good, falling accuracy is not.
const metrics = [
{ name: 'Days to close', before: '9.4', after: '4.2', delta: '−55%', better: 'down' },
{ name: 'Ad-hoc data requests / month', before: '212', after: '61', delta: '−71%', better: 'down' },
{ name: 'Certified metrics published', before: '0', after: '340', delta: '+340', better: 'up' },
{ name: 'Forecast accuracy band', before: '±6.1pp', after: '±3.7pp', delta: '−2.4pp', better: 'down' },
]
</script>
<template>
<section data-slot="case-study-metric-comparison" class="bg-background">
<div class="mx-auto max-w-4xl px-6 py-20 lg:py-28">
<Badge variant="secondary">Northwind Logistics</Badge>
<h2 class="mt-4 text-3xl font-semibold tracking-tight text-balance sm:text-4xl">
Two quarters either side of the rollout
</h2>
<p class="text-muted-foreground mt-3 text-lg">
Their numbers, their definitions, measured the same way before and after. Nothing normalised.
</p>
<Card class="mt-8">
<CardContent class="p-0">
<Table>
<TableHeader>
<TableRow>
<TableHead>Metric</TableHead>
<TableHead class="text-right">Q4 2025</TableHead>
<TableHead class="text-right">Q2 2026</TableHead>
<TableHead class="text-right">Change</TableHead>
</TableRow>
</TableHeader>
<TableBody>
<TableRow v-for="metric in metrics" :key="metric.name">
<TableCell class="font-medium">{{ metric.name }}</TableCell>
<TableCell class="text-muted-foreground text-right font-mono text-sm">{{ metric.before }}</TableCell>
<TableCell class="text-right font-mono text-sm font-semibold">{{ metric.after }}</TableCell>
<TableCell class="text-right">
<span class="text-success inline-flex items-center gap-1.5 font-mono text-sm">
<component
:is="metric.better === 'down' ? TrendingDown : TrendingUp"
class="size-3.5"
aria-hidden="true"
/>
{{ metric.delta }}
</span>
</TableCell>
</TableRow>
</TableBody>
</Table>
<Separator />
<p class="text-muted-foreground px-6 py-4 text-xs leading-relaxed">
Measured from their own close calendar and ticket queue. The rollout completed between the two quarters; no
headcount was added or removed in finance during the period.
</p>
</CardContent>
</Card>
<Button class="mt-8">
Read how they did it
<ArrowRight class="ml-2 size-4" aria-hidden="true" />
</Button>
</div>
</section>
</template>
<script setup lang="ts">
import { ArrowRight } from 'lucide-vue-next'
import { Badge } from '@/components/ui/badge'
import { Button } from '@/components/ui/button'
import { Separator } from '@/components/ui/separator'
// One result per customer. A second number halves the weight of the first.
const results = [
{ wordmark: 'Northwind', metric: '5 days', label: 'off the monthly close' },
{ wordmark: 'Halden', metric: '71%', label: 'fewer ad-hoc requests' },
{ wordmark: 'Verity', metric: '2.4pp', label: 'tighter forecast band' },
{ wordmark: 'Calder', metric: '11 → 1', label: 'reporting spreadsheets' },
]
</script>
<template>
<section data-slot="case-study-results-strip" class="border-border bg-card border-y">
<div class="mx-auto max-w-6xl px-6 py-10">
<div class="flex flex-wrap items-center justify-between gap-4">
<Badge variant="secondary">Proven</Badge>
<Button variant="link" class="h-auto p-0 text-sm">
All case studies
<ArrowRight class="ml-1.5 size-3.5" aria-hidden="true" />
</Button>
</div>
<div class="mt-6 grid gap-6 sm:grid-cols-2 lg:grid-cols-4 lg:gap-0">
<div v-for="(result, index) in results" :key="result.wordmark" class="relative lg:px-6 lg:first:pl-0">
<p class="text-sm font-semibold tracking-[0.18em] uppercase">{{ result.wordmark }}</p>
<p class="font-display mt-3 text-3xl font-bold tracking-tight">{{ result.metric }}</p>
<p class="text-muted-foreground mt-1 text-sm">{{ result.label }}</p>
<Separator
v-if="index < results.length - 1"
orientation="vertical"
class="absolute top-0 right-0 hidden h-full lg:block"
/>
</div>
</div>
</div>
</section>
</template>
Raw manifest:https://uipkge.dev/r/vue/case-study.json